Lumpsum vs SIP: Which Mutual Fund Investment Strategy Actually Wins?
Lumpsum and SIP investing win in different market conditions. We run a side-by-side ₹6 lakh example to show exactly when each strategy pulls ahead.
Compare monthly SIP mutual fund investments against a one-time lump sum deposit. Calculate returns, invested amounts, and wealth accumulated.
SIP Investment yields more returns than Lumpsum Investment.
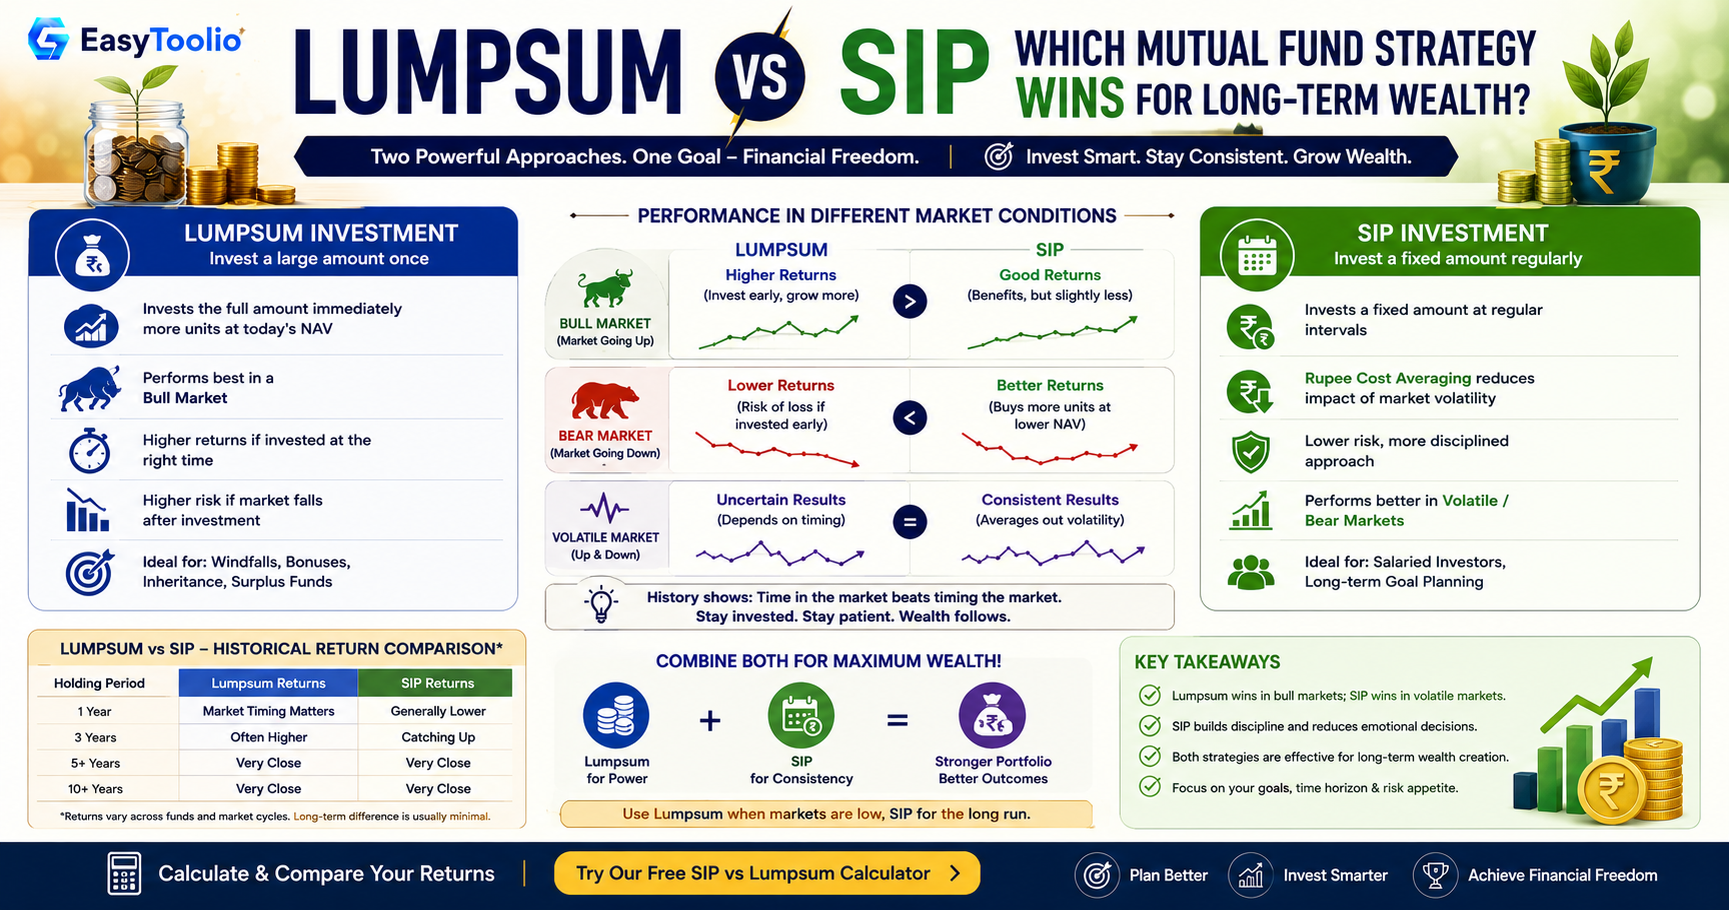
A SIP spreads your investment across many months, so you automatically buy more units when the market is down and fewer when it is up. This averages out your purchase price and removes the pressure of guessing the "right" entry point.
A lumpsum investment, by contrast, puts the entire amount to work on a single day. If that day happens to land near a market peak, the corpus can take years to recover the ground lost to a correction — but if it lands near a market bottom, a lumpsum captures the full upside from day one in a way a SIP cannot.
In a sustained bull market, a lumpsum investment usually outperforms a SIP of the same total value, simply because every rupee is compounding from the very first day instead of trickling in over months or years.
In a volatile or falling market, a SIP tends to hold up better, since the averaging effect softens the blow of buying at a temporary high and lets you keep accumulating units cheaply during the dip.
Both formulas above assume a smooth, constant annual return, but real markets never move in a straight line. Historically, whether SIP or lumpsum came out ahead over any given 10-15 year window in an index depended almost entirely on where that window started relative to a market cycle — lumpsum investors who entered just before a downturn lagged SIP investors for years, while those who entered after a crash pulled ahead almost immediately.
This is why the "winner" in this calculator is not a permanent verdict — it is a projection based on the flat return rate you enter. Treat the comparison as a way to understand the mechanics of each approach, not as a guarantee of which one will actually perform better for your specific investment horizon.
Many investors who receive a windfall — a bonus, an inheritance, or the sale of an asset — don't have to choose purely between SIP and lumpsum. A Systematic Transfer Plan (STP) lets you park the entire sum in a low-volatility liquid or debt fund first, then set up automatic monthly transfers of a fixed amount into an equity fund, effectively turning a lumpsum into a synthetic SIP.
This hybrid approach earns modest interest on the idle portion while it waits its turn, and it staggers your equity entry points the same way a regular SIP would — giving you rupee cost averaging on a lumpsum you were otherwise tempted to deploy all at once.
Consider an investor who can commit ₹10,000 a month for 15 years through a SIP, versus a friend who instead invests the equivalent ₹18 lakh as a single lumpsum on day one. At an illustrative 12% annual return, the SIP investor's total contribution of ₹18 lakh grows to a corpus of roughly ₹50 lakh, while the lumpsum investor's one-time ₹18 lakh grows to roughly ₹98 lakh over the same 15 years.
The gap looks dramatic, but it exists only because every lumpsum rupee compounds for the full 15 years, whereas most SIP instalments are invested for a much shorter average period. This is illustrative math at a constant assumed rate, not a guaranteed outcome — use the calculator above with your own numbers to see how the gap changes with a different amount, rate, or tenure.
It depends entirely on market direction during the investment period. In a rising (bull) market, a lumpsum invested early usually wins because the full amount compounds from day one. In a volatile or falling market, SIP usually wins because rupee cost averaging buys more units when prices are low.
Lumpsum investing tends to work better when you have a large sum available, a long investment horizon, and markets are reasonably valued or trending upward, since the entire amount gets more time to compound.
No. Rupee cost averaging helps most in volatile or falling markets, where it buys more units at lower prices. In a steadily rising market, a SIP investor actually receives a lower average return than someone who invested the full amount as a lumpsum right at the start.
Yes. Many investors start a regular SIP for disciplined monthly investing and also add lumpsum top-ups whenever they receive a bonus, windfall, or surplus cash, combining the benefits of both approaches in the same portfolio.
Because a lumpsum investment goes in all at once, its outcome is more sensitive to the market level on that specific day. Investing a lumpsum right before a market downturn can meaningfully hurt short-term returns, which is a risk SIP investors are naturally less exposed to.
SIP is generally considered lower-risk from a timing perspective because it spreads your entry price across many dates instead of a single one. It does not reduce the underlying market risk of the fund itself, only the risk of a single bad entry point.
A common middle path is a Systematic Transfer Plan (STP): park the windfall in a low-risk liquid fund, then automatically transfer a fixed amount into your equity fund every month, similar to a SIP, while the remaining balance keeps earning some return until it is transferred.
Calculate returns for a single SIP scenario with compounding interest.
Calculate returns for a single one-time lumpsum investment.
Compare two SIP scenarios side by side.
Compare mutual fund SIP returns against traditional bank FDs.
Compare secured Car Loans against unsecured Personal Loans. Analyze interest rates, EMIs, processing fees, and total repayment costs.
Compare two loan options side-by-side. Evaluate EMI amounts, total interest payable, and total cost to choose the most cost-effective loan.
Compare two Fixed Deposit plans to find the best returns. Analyze different interest rates, compounding frequencies, and tenure options.
Plain-language explainers that sit next to this tool.
Lumpsum and SIP investing win in different market conditions. We run a side-by-side ₹6 lakh example to show exactly when each strategy pulls ahead.
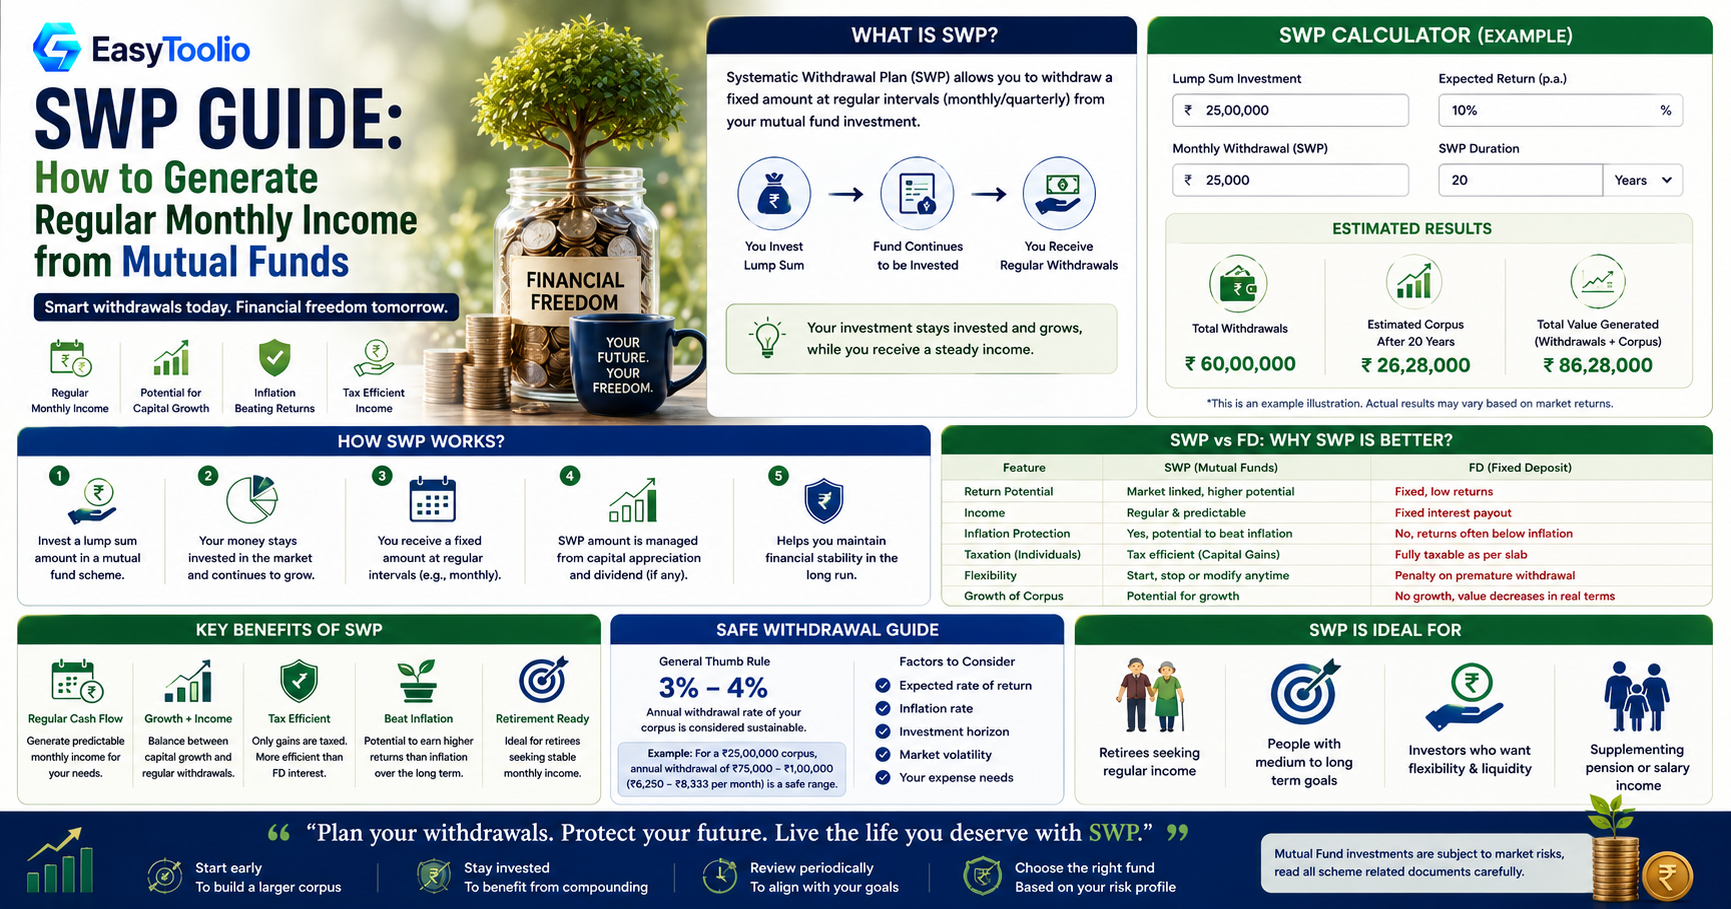
A Systematic Withdrawal Plan can turn your mutual fund corpus into a monthly paycheck. Here is how to set a withdrawal rate that does not run out.
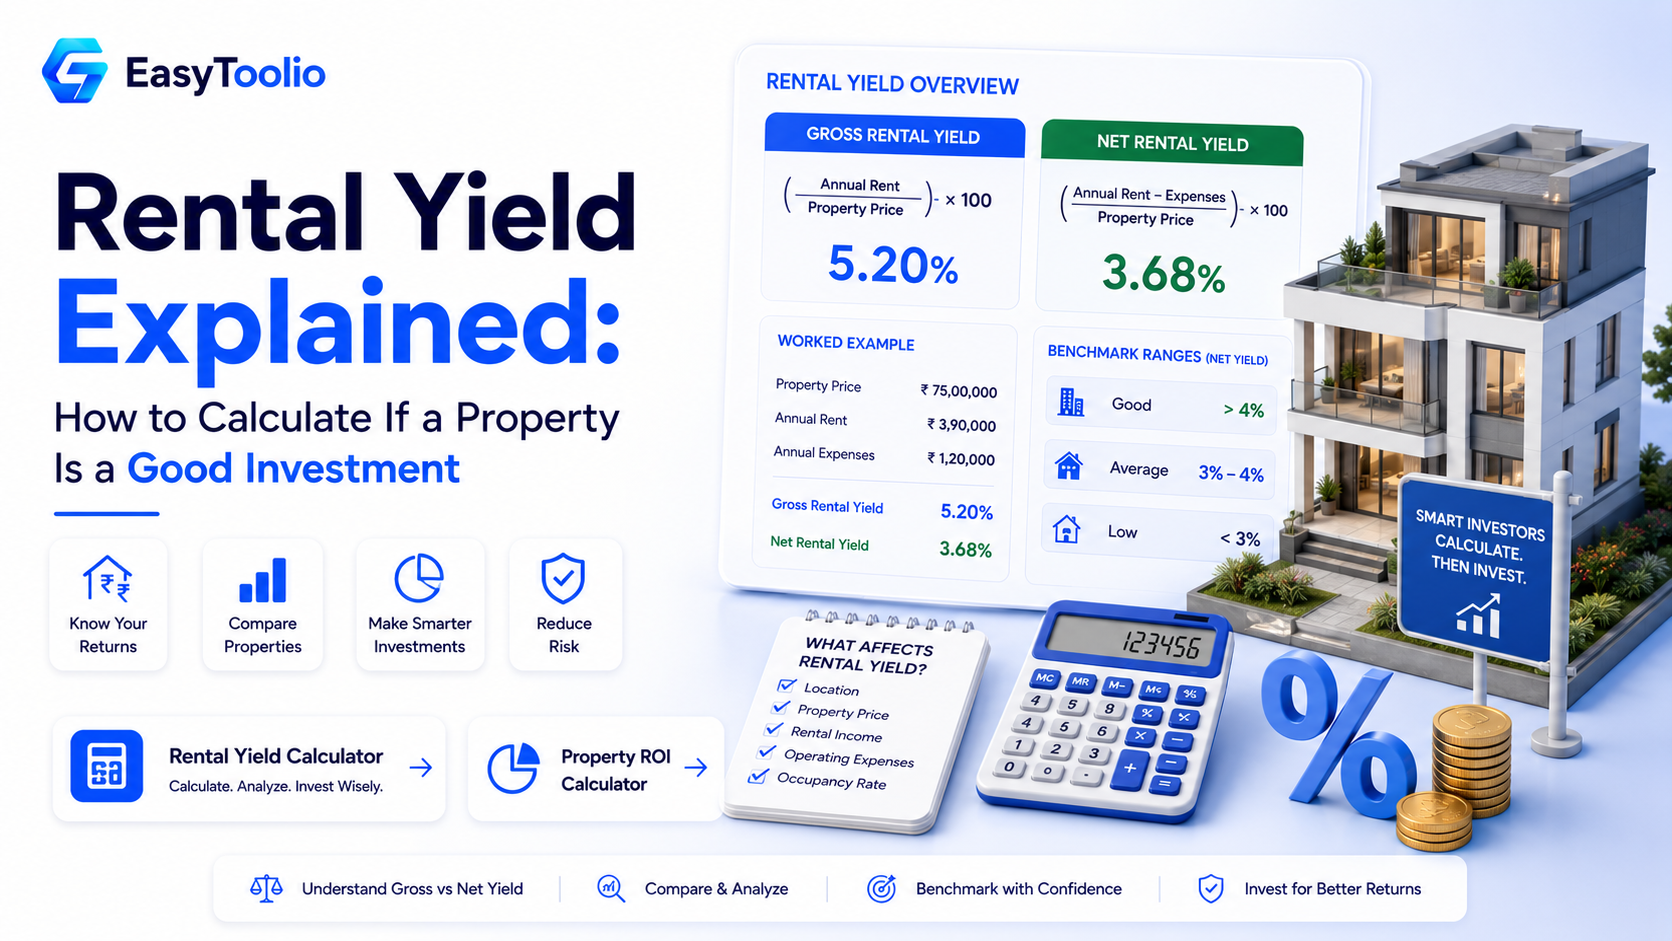
Rental yield tells you whether a property is a good income investment, not just a good home. Learn the gross vs net yield formulas, a worked example, and healthy benchmark ranges.
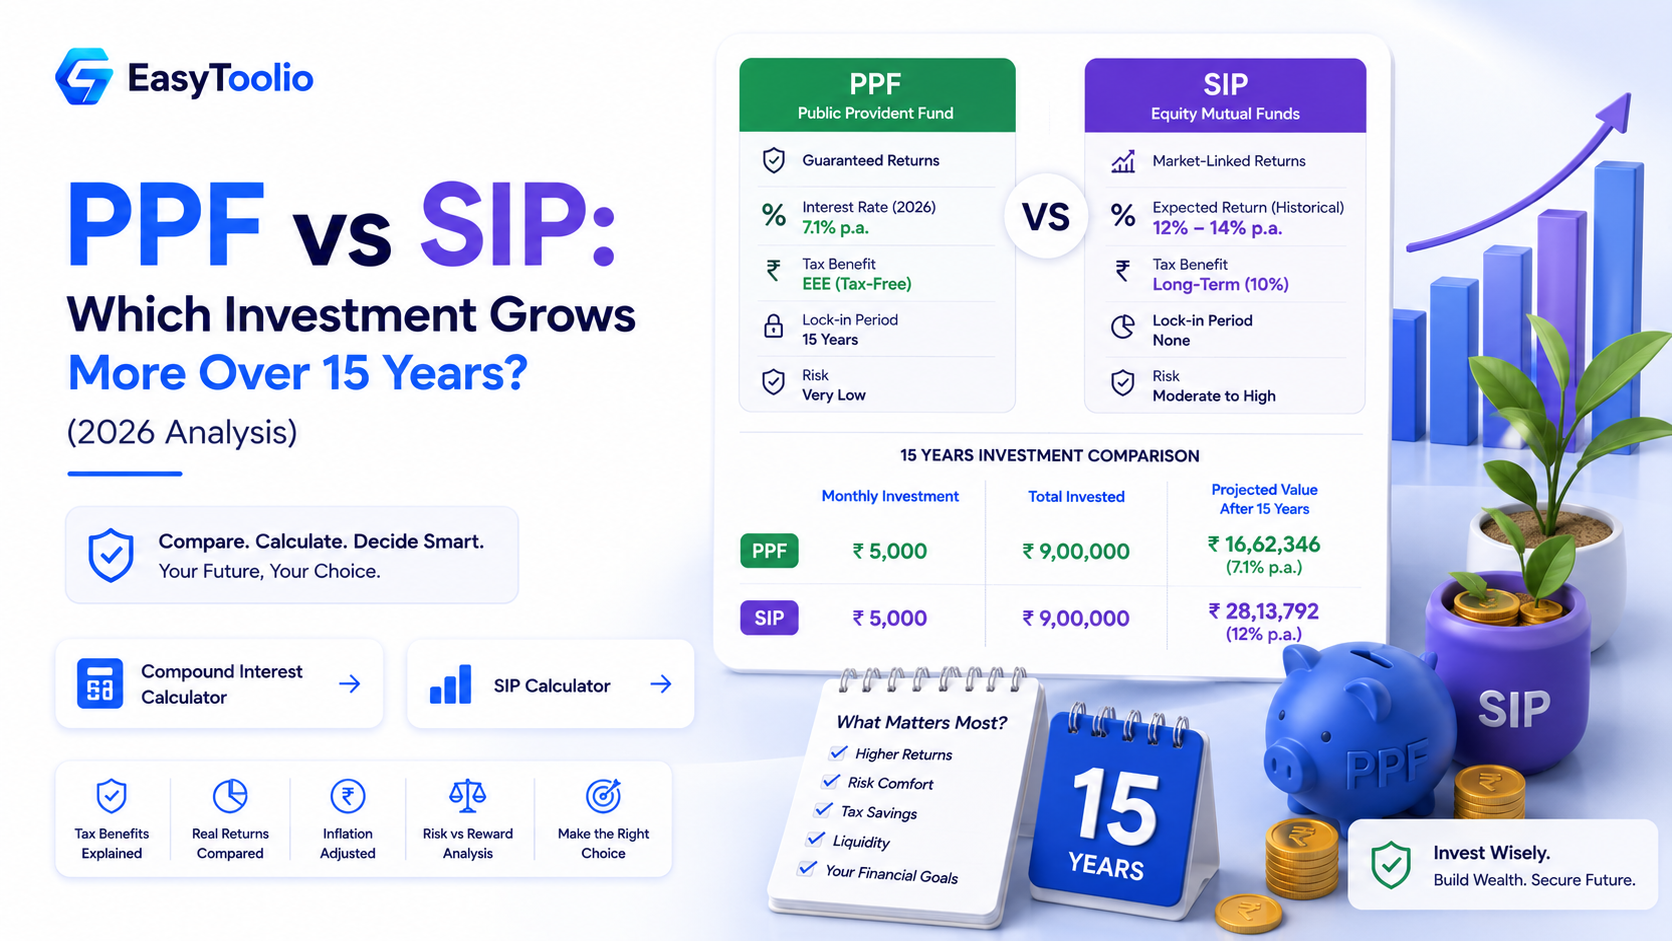
PPF gives guaranteed 7.1% tax-free returns. SIP in equity mutual funds has historically returned 12–14%. But which one actually puts more money in your pocket after 15 years, after accounting for taxes, inflation, and risk? We run the numbers.
Search 190+ free tools by name, or pick a category below. Every one runs instantly in your browser — no signup, nothing to install.
Tap a star to rate us instantly.