
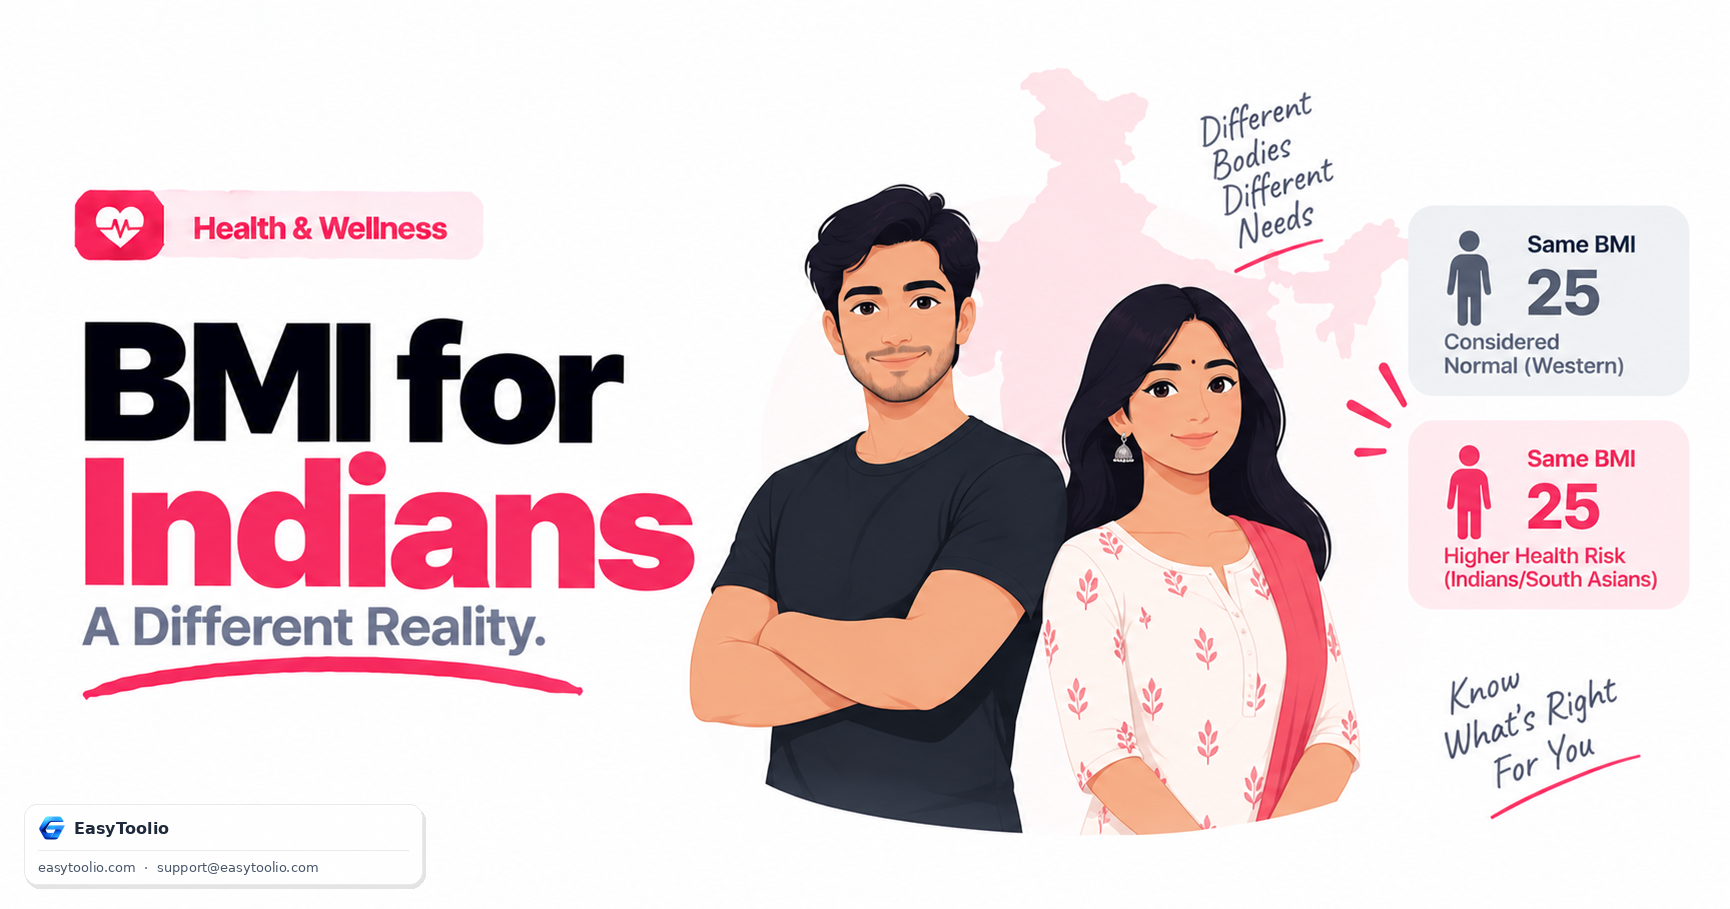
If you are an Indian adult with a BMI of 24 — technically "normal weight" by the standard Western chart — you may still be at elevated risk for Type 2 diabetes, hypertension, and cardiovascular disease. This is not a flaw in your health; it is a flaw in the chart.
Research over the past two decades has established clearly that South Asians carry significantly more body fat at the same BMI compared to people of European descent. This difference has real clinical consequences.
The Standard BMI Chart — and Its Origins
The Body Mass Index formula (weight in kg ÷ height in metres²) was developed by Belgian mathematician Adolphe Quetelet in 1832. The widely used cut-off points — underweight below 18.5, normal 18.5–24.9, overweight 25–29.9, obese above 30 — were derived primarily from studies of European and North American populations in the mid-20th century.
These thresholds were never validated for South Asian, East Asian, or Middle Eastern populations. Yet they became the global default.
What Research Shows for South Asians
Multiple large-scale studies from India, Singapore, and the UK (including studies on Indian-origin diaspora populations) have found:
- At the same BMI, South Asians have 3–5% higher body fat percentage than white Europeans
- South Asians begin to show insulin resistance and metabolic abnormalities at BMI 23, not at 25
- The risk of Type 2 diabetes begins rising significantly at BMI 21 for South Asians — a full 4 points below the Western trigger
A landmark 2004 WHO expert consultation documented these findings and recommended alternative BMI cut-off points for Asian populations.
The WHO's Asian BMI Cutoffs
In 2004, the WHO issued a report recommending that Asian countries consider the following additional cut-off points:
| BMI | Standard WHO Classification | Asian Risk Level |
|---|---|---|
| < 18.5 | Underweight | Underweight |
| 18.5 – 22.9 | Normal weight | Normal weight |
| 23.0 – 24.9 | Normal (by standard) | Increased risk |
| 25.0 – 29.9 | Overweight | High risk (equivalent to obese in Western populations) |
| ≥ 30.0 | Obese | Very high risk |
The Indian Council of Medical Research (ICMR) and several Indian clinical bodies have recommended using a BMI cut-off of ≥ 23 as overweight and ≥ 27.5 as obese for Indian adults.
Why South Asians Are Different: The Biology
The mechanism behind this difference is well-studied:
1. Visceral fat accumulation. South Asians tend to accumulate fat preferentially in the abdominal area (visceral fat) rather than subcutaneous fat. Visceral fat is metabolically active — it releases inflammatory markers and disrupts insulin signalling.
2. Lower muscle mass. South Asians typically have lower skeletal muscle mass relative to total body weight compared to Europeans. Muscle is metabolically active tissue; less muscle means lower insulin sensitivity.
3. Genetic variants. Several gene variants common in South Asian populations (including variants affecting fat storage, lipid metabolism, and glucose regulation) increase metabolic risk independent of BMI.
4. The "thin-fat" phenotype. Indian babies and adults are described in research as having a "thin-fat" phenotype — relatively normal BMI with abnormally high body fat and low muscle mass. This phenotype is associated with insulin resistance from an early age.
What This Means in Practice
If you are Indian and your BMI is:
- Below 18.5: Underweight — similar interpretation as standard chart
- 18.5 – 22.9: Normal weight — healthy range
- 23.0 – 24.9: At increased metabolic risk — consider waist circumference and fasting glucose screening
- 25.0 – 27.4: Overweight by Asian standards — high risk for metabolic disease, lifestyle intervention recommended
- ≥ 27.5: Obese by ICMR definition — elevated risk for diabetes, hypertension, and cardiovascular events
Waist circumference is an additional marker your doctor may check: Indian men are considered at elevated risk with waist > 90 cm; Indian women with waist > 80 cm.
A Worked Example: Calculating and Interpreting BMI
BMI is calculated as weight in kilograms divided by height in metres, squared:
BMI = Weight (kg) ÷ [Height (m)]²
Take a 32-year-old Indian man who weighs 72 kg and is 1.70 m tall:
- Height squared: 1.70 × 1.70 = 2.89
- BMI = 72 ÷ 2.89 = 24.9
On the standard WHO chart, 24.9 sits right at the top edge of "normal weight." Under the Asian action points described above, the same 24.9 falls inside the 23.0–24.9 "increased risk" band — one step below the overweight threshold. In this example, the man is functionally in the increased-risk zone under Asian-specific guidance, even though a Western chart would still call him "normal." This is exactly the gap this article is about — the number doesn't change, only the interpretation does. Our BMI Calculator automates this arithmetic and shows both interpretations side by side.
Where BMI Falls Short, Even With Adjusted Cutoffs
Asian-specific action points improve on the standard chart, but BMI — Asian or Western — still has structural limitations worth knowing:
- It cannot tell muscle from fat. A muscular, physically active person and a sedentary person of the same height and weight get the same BMI, even though their metabolic risk is very different.
- It does not account for age. Older adults naturally lose muscle mass and gain fat even if body weight stays constant, so the same BMI can mean different body composition at 25 versus 65.
- It does not separate men and women. Women typically carry a higher healthy body-fat percentage than men at the same BMI, but the chart uses one scale for both.
- It says nothing about fat distribution. Two people with identical BMI can have very different visceral (abdominal) fat, which is the fat most strongly linked to diabetes and heart disease risk.
- It was never designed as a diagnostic tool. BMI began as a population-level screening statistic, not an individual clinical measurement — a point often lost when a single number gets treated as a verdict.
None of this means BMI is useless. It remains a fast, free, reasonably reliable screening signal at a population level. It simply works best alongside other measurements, not in isolation.
Beyond BMI: Other Metrics Worth Checking
Because BMI alone misses body composition and fat distribution, doctors and researchers often pair it with:
- Waist-to-Hip Ratio — captures how much fat is stored around the abdomen versus the hips, a stronger predictor of cardiovascular risk than BMI alone in several South Asian cohort studies.
- Waist-to-Height Ratio — a simple screening ratio (waist circumference should generally stay below half your height) that some researchers argue tracks metabolic risk better than BMI across different ethnicities.
- Body Fat Percentage — estimates the actual proportion of fat versus lean mass, which is what BMI is trying to approximate indirectly.
- BMR Calculator and Calorie Calculator — useful once you know your risk category, for planning a realistic calorie target rather than guessing.
Using two or three of these together gives a far more complete picture than BMI alone, especially for South Asians where the "thin-fat" phenotype can hide risk behind a normal-looking number.
Common Mistakes When Interpreting BMI
- Using the Western 25/30 cut-offs and assuming you're safe. As shown above, an Indian adult can be in the "increased risk" zone at a BMI a standard chart would still call normal.
- Treating a single BMI reading as a diagnosis. BMI is a screening flag, not a lab result — it should prompt further checks (waist circumference, blood sugar, lipid panel), not a conclusion on its own.
- Ignoring BMI entirely because "it doesn't apply to me." The adjusted Asian cut-offs exist precisely because the underlying risk pattern is real and well documented — the fix is to use the right threshold, not to discard the metric.
- Comparing your BMI to a very muscular athlete's BMI. Athletes with high muscle mass can have an "overweight" BMI with low body fat; that comparison isn't meaningful for a sedentary adult evaluating their own risk.
- Skipping a doctor visit because an online calculator looked reassuring. No calculator, including ours, replaces an actual clinical assessment when the numbers suggest elevated risk.
Interpreting Your BMI
Our BMI Calculator displays your result alongside the standard interpretation and a note about Asian-population research. Use it as one data point, not a diagnosis. For a full picture of metabolic health, a fasting blood sugar test, HbA1c, and lipid panel are far more informative than BMI alone.
The single most actionable thing most Indians can do at any BMI: increase skeletal muscle mass through resistance training. It directly improves insulin sensitivity — the core metabolic problem — independent of weight change.
This article is general educational information based on published WHO and ICMR guidance, not individual medical advice. If your BMI or waist circumference falls in an elevated-risk range, discuss it with a doctor who can assess your full history rather than relying on any single number.
Frequently Asked Questions
Q: At what BMI are Indians considered overweight or obese? A: The ICMR recommends a cut-off of BMI ≥ 23 as overweight and ≥ 27.5 as obese for Indian adults, compared to the standard WHO thresholds of 25 and 30. This is because South Asians show increased metabolic risk starting at BMI 23, four points below the Western trigger.
Q: Why does the same BMI mean higher health risk for South Asians than for Europeans? A: At an identical BMI, South Asians carry 3–5% more body fat, tend to store it as metabolically active visceral fat, and typically have lower skeletal muscle mass — the combination known as the "thin-fat" phenotype. This raises insulin resistance risk even when weight looks "normal" on the standard chart.
Q: What waist circumference is considered risky for Indians? A: Indian men are considered at elevated metabolic risk with a waist circumference above 90 cm, and Indian women above 80 cm. Doctors often use this alongside BMI, since it captures abdominal fat that BMI alone can miss.
Q: Does BMI work the same way for children as for adults? A: No. Child and adolescent BMI is interpreted using age- and sex-specific growth-chart percentiles, not the fixed adult cut-offs discussed in this article. Pediatric BMI assessment should follow a growth chart appropriate for the child's age, ideally reviewed with a pediatrician.
Q: Should I rely on BMI alone to decide if I need to lose weight? A: No. BMI is a useful first screening step, but it doesn't measure body fat, muscle mass, or fat distribution directly. Pair it with a waist measurement or body-fat estimate, and treat any result suggesting elevated risk as a reason to consult a healthcare provider rather than a final verdict.